Demo
We will demonstrate how psy-ugrid can be used to visualize unstructured
data on it’s native grid. We will use two demo files here:
In [1]: import psyplot.project as psy
   ...:
   ...: psy.rcParams["plotter.plot2d.cmap"] = "viridis"
   ...:

In [2]: ds_triangular = psy.open_dataset("simple_triangular_grid_si0.nc")
   ...: ds_triangular
   ...:
Out[2]:
<xarray.Dataset> Size: 92B
Dimensions:           (nMesh2_node: 4, nMesh2_face: 2, Three: 3, time: 1)
Coordinates:
    Mesh2             int32 4B ...
    Mesh2_node_x      (nMesh2_node) float32 16B ...
    Mesh2_node_y      (nMesh2_node) float32 16B ...
    Mesh2_face_nodes  (nMesh2_face, Three) int32 24B ...
  * time              (time) datetime64[ns] 8B 1951-01-01
Dimensions without coordinates: nMesh2_node, nMesh2_face, Three
Data variables:
    Mesh2_ndvar       (time, nMesh2_node) float32 16B ...
    Mesh2_fcvar       (time, nMesh2_face) float32 8B ...
Attributes:
    title:              test mesh
    institution:        Universitaet Hamburg
    contact:            None
    source:             None
    references:         None
    comment:            None
    Conventions:        UGRID-0.9
    creation_date:      2015-01-26 09:19:01  01:00
    modification_date:  2015-01-26 09:19:01  01:00

In [3]: ds_flexible = psy.open_dataset("simple_flexible_grid_si0.nc")
   ...: ds_flexible
   ...:
Out[3]:
<xarray.Dataset> Size: 200B
Dimensions:           (nMesh2_node: 5, nMesh2_face: 2, nMaxMesh2_face_nodes: 4,
                       time: 1)
Coordinates:
    Mesh2             int32 4B ...
    Mesh2_node_x      (nMesh2_node) float32 20B ...
    Mesh2_node_y      (nMesh2_node) float32 20B ...
    Mesh2_face_nodes  (nMesh2_face, nMaxMesh2_face_nodes) float64 64B ...
  * time              (time) datetime64[ns] 8B 1951-01-01
  * nMesh2_face       (nMesh2_face) int64 16B 0 1
  * nMesh2_node       (nMesh2_node) int64 40B 0 1 2 3 4
Dimensions without coordinates: nMaxMesh2_face_nodes
Data variables:
    Mesh2_ndvar       (time, nMesh2_node) float32 20B ...
    Mesh2_fcvar       (time, nMesh2_face) float32 8B ...
Attributes:
    title:              test mesh
    institution:        Universitaet Hamburg
    contact:            None
    source:             None
    references:         None
    comment:            None
    Conventions:        UGRID-0.9
    creation_date:      2015-01-26 09:19:01  01:00
    modification_date:  2015-01-26 09:19:01  01:00
The ugrid decoder automatically realized the mesh attributes in some of the
variables and therefore already assigned some coordinates for the netCDF
variables that hold the connectivity information.
Variables that hold a mesh attribute (such as the variable Mesh2_fcvar
in these datasets) automatically use the UGRIDDecoder
In [4]: ds_triangular.Mesh2_fcvar.psy.decoder
Out[4]: <psy_ugrid.decoder.UGridDecoder at 0x7ff8c6e5e280>
Visualization of face variables
According to the UGRID conventions, variables can either represent a node in
the mesh, a face or an edge. Very often, however, the netCDF files only contain
the so-called face-node-connectivty, i.e. the information on how the faces
look like. The decoder of the psy-ugrid package is able to decode this
information and generate polygons that can then be visualized by plotmethods
of the psyplot plugin psy-simple or psy-maps:
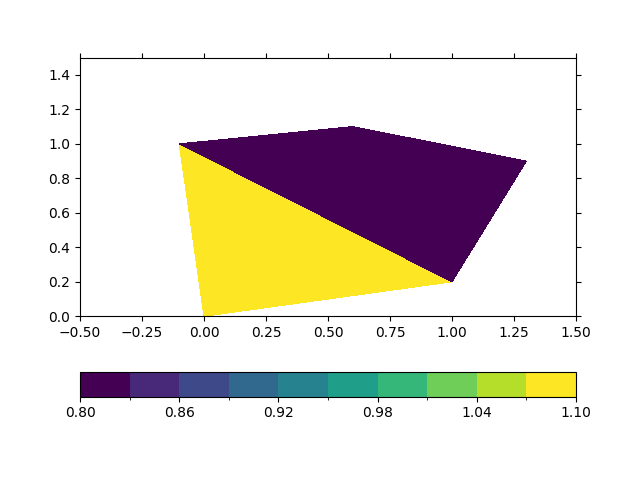
In [5]: ds_triangular.psy.plot.plot2d(name="Mesh2_fcvar")
Out[5]: psyplot.project.Project([    arr0: 1-dim DataArray of Mesh2_fcvar, with (nMesh2_face)=(2,), Mesh2=-2147483647, time=1951-01-01])

This even works out of the box for files, where we have mixed triangular and quadriliteral faces:
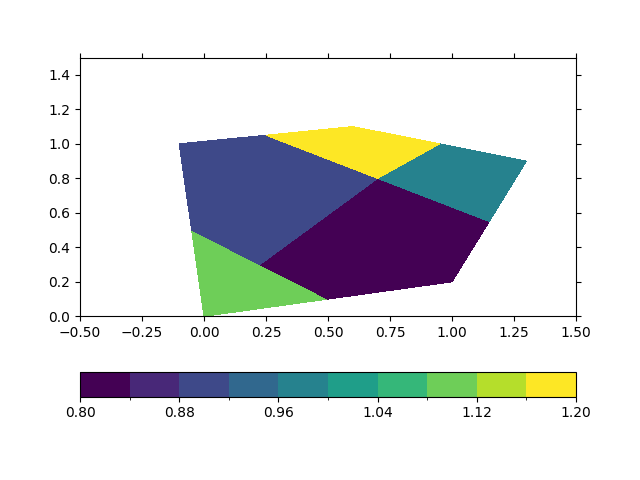
In [6]: ds_flexible.psy.plot.plot2d(name="Mesh2_fcvar")
Out[6]: psyplot.project.Project([    arr1: 1-dim DataArray of Mesh2_fcvar, with (nMesh2_face)=(2,), Mesh2=-2147483647, time=1951-01-01])

Visualization of node and edge variables
As soon as a variable is defined on a node or edge variable, psy-ugrid
computes the dual mesh by deriving the face-edge-connectivity and more. We
implemented a very efficient cython-based algorithm to do so, even for large
files. The derived polygons for this so-called dual mesh are then used for
visualizing the data.
In [7]: ds_triangular.psy.plot.plot2d(name="Mesh2_ndvar")
Out[7]: psyplot.project.Project([    arr2: 1-dim DataArray of Mesh2_ndvar, with (nMesh2_node)=(4,), Mesh2=-2147483647, time=1951-01-01])

And again, this even works out of the box for files, where we have mixed triangular and quadriliteral faces:
In [8]: ds_flexible.psy.plot.plot2d(name="Mesh2_ndvar")
Out[8]: psyplot.project.Project([    arr3: 1-dim DataArray of Mesh2_ndvar, with (nMesh2_node)=(5,), Mesh2=-2147483647, time=1951-01-01])
