Note
This example requires the demo.nc file.
Bar plot demo
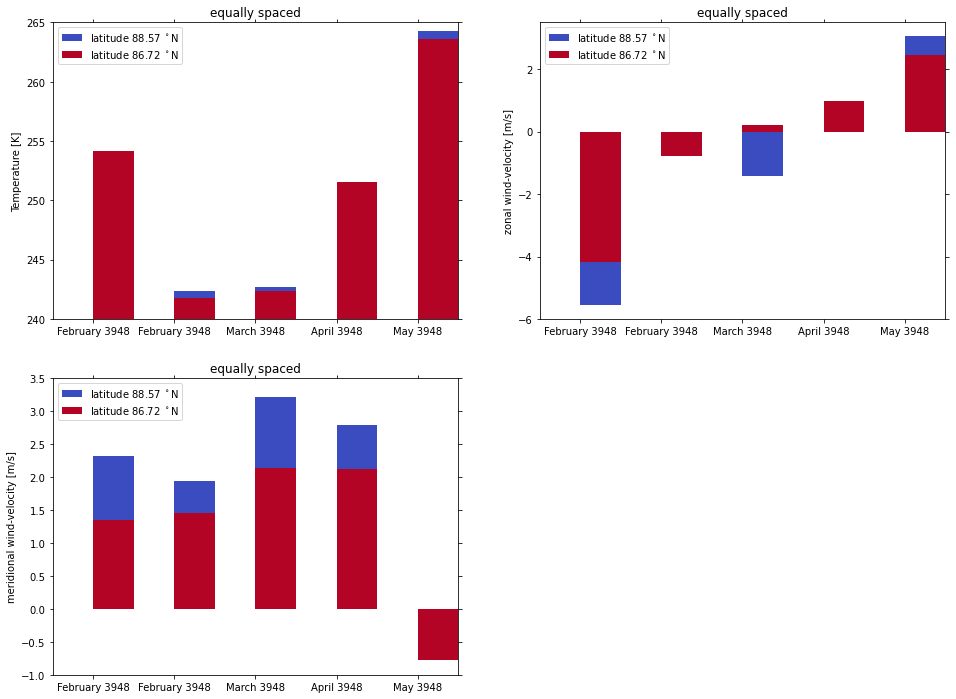
This example shows you how to make a bar plot using the psyplot.project.plot.barplot method.
[1]:
import psyplot.project as psy
%matplotlib inline
%config InlineBackend.close_figures = False
[2]:
axes = iter(psy.multiple_subplots(2, 2, n=3))
for var in ['t2m', 'u', 'v']:
    psy.plot.barplot(
        'demo.nc',  # netCDF file storing the data
        name=var, # one plot for each variable
        y=[0, 1],  # two bars in total
        z=0, x=0,      # choose latitude and longitude as dimensions
        ylabel="{desc}",  # use the longname and units on the y-axis
        ax=next(axes),
        color='coolwarm', xticklabels='%B %Y',
        legendlabels='latitude %(y)1.2f $^\circ$N', legend='upper left',
        title='equally spaced'
    )
bars = psy.gcp(True)
bars.show()
/home/circleci/miniconda3/envs/docs/lib/python3.8/site-packages/psy_simple/plotters.py:1223: FutureWarning: Index.is_all_dates is deprecated, will be removed in a future version. check index.inferred_type instead.
  if index.is_all_dates:
/home/circleci/miniconda3/envs/docs/lib/python3.8/site-packages/psy_simple/plotters.py:1223: FutureWarning: Index.is_all_dates is deprecated, will be removed in a future version. check index.inferred_type instead.
  if index.is_all_dates:
/home/circleci/miniconda3/envs/docs/lib/python3.8/site-packages/psy_simple/plotters.py:1223: FutureWarning: Index.is_all_dates is deprecated, will be removed in a future version. check index.inferred_type instead.
  if index.is_all_dates:
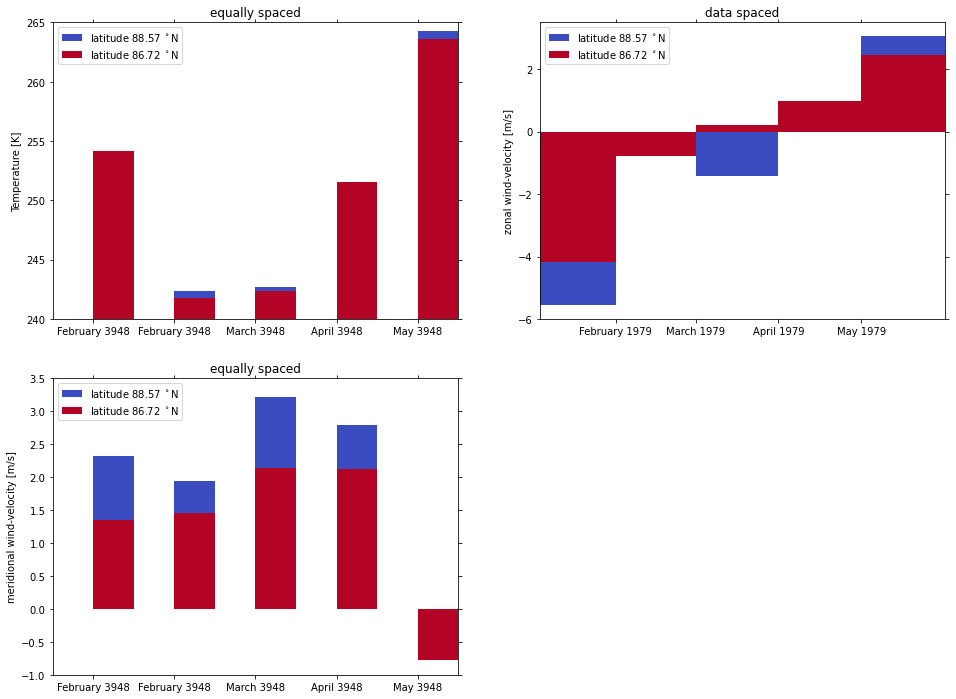
The default is that all bars have the same width. You can however change that by setting the widths keyword to data
[3]:
bars(name='u').update(widths='data', xticks='month', title='data spaced')
bars.show()
/home/circleci/miniconda3/envs/docs/lib/python3.8/site-packages/psy_simple/plotters.py:2354: FutureWarning: Index.is_all_dates is deprecated, will be removed in a future version. check index.inferred_type instead.
  is_datelike = arr.indexes[arr.dims[0]].is_all_dates
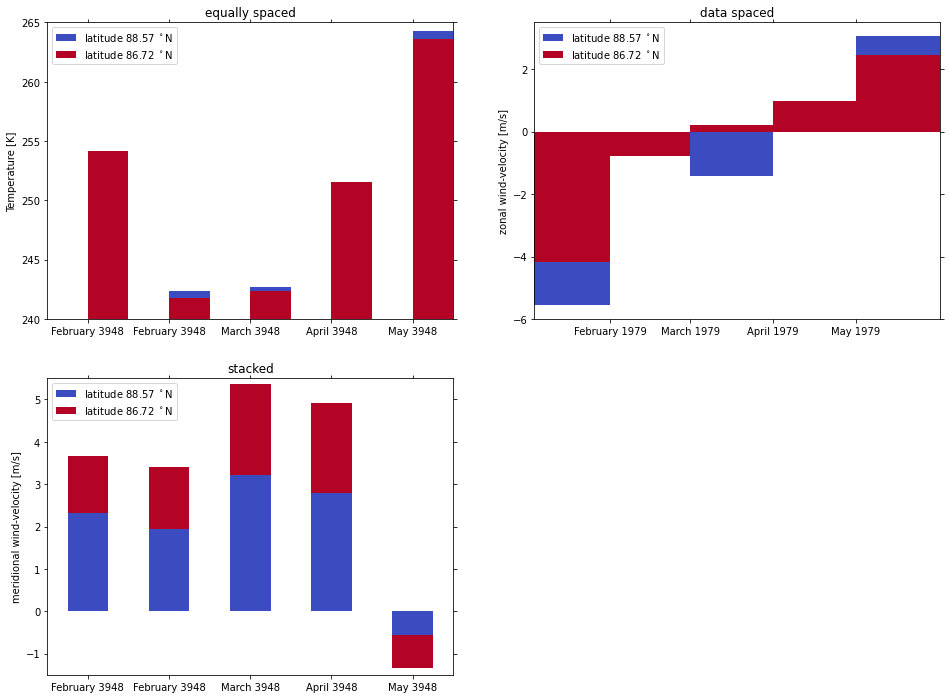
Or you make a stacked plot
[4]:
bars(name='v').update(plot='stacked', title='stacked')
bars.show()
[5]:
psy.close('all')