Note
This example requires the demo.nc file.
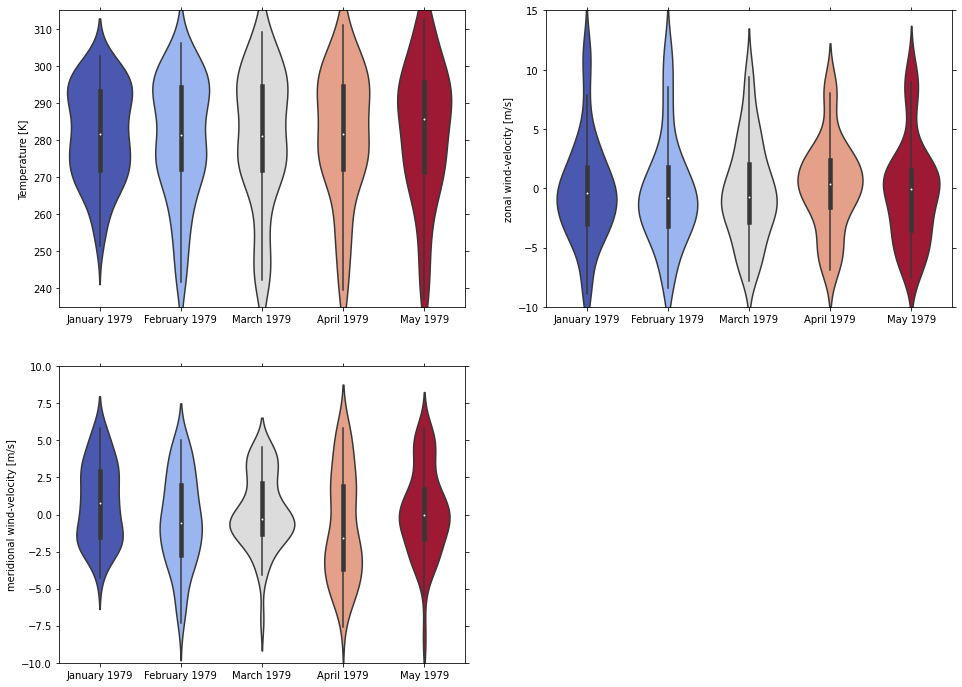
Violin plot demo
This example shows you how to make a violin plot using the psyplot.project.ProjectPlotter.violinplot method.
[1]:
import psyplot.project as psy
[2]:
axes = iter(psy.multiple_subplots(2, 2, n=3))
for var in ['t2m', 'u', 'v']:
    psy.plot.violinplot(
        'demo.nc',  # netCDF file storing the data
        name=var, # one plot for each variable
        t=range(5),  # one violin plot for each time step
        z=0, x=0,      # choose latitude and longitude as dimensions
        ylabel="{desc}",  # use the longname and units on the y-axis
        ax=next(axes),
        color='coolwarm', legend=False,
        xticklabels='%B %Y'  # choose xaxis labels to use month and year info,
    )
[3]:
psy.close('all')