Note
Vector plot
Demonstration of the plotting of 2D vectors
The vector plotmethod uses matplotlibs quiver and streamplot functions to create the plot. This plot method requires two variables: 'u' for the wind in x-direction, 'v' for the wind in y-direction.
Note that this method is extended by the mapvector plot method of the psy-maps plugin for visualization on the projected globe.
[1]:
import psyplot.project as psy
import xarray as xr
%matplotlib inline
%config InlineBackend.close_figures = False
import numpy as np
[2]:
x2 = np.arange(0, 2 * np.pi, .2)
y2 = np.arange(0, 2 * np.pi, .2)
x22d, y22d = np.meshgrid(x2, y2)
ds2 = xr.Dataset(
    {'u': xr.Variable(('x', 'y'), np.cos(x22d)),
     'v': xr.Variable(('x', 'y'), np.sin(y22d))},
    {'x': xr.Variable(('x', ), x2),
     'y': xr.Variable(('y', ), y2)})
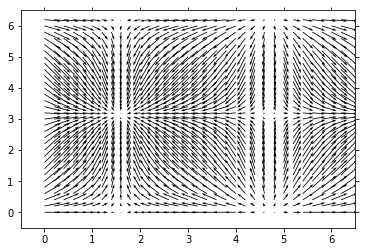
The default is a quiver plot
[3]:
p = psy.plot.vector(ds2, name=[['u', 'v']], arrowsize=20.0)
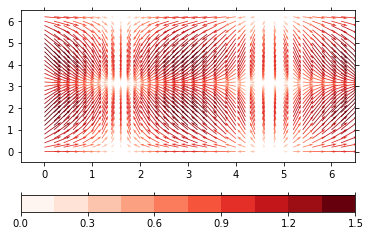
You can also apply a colormap to the vectors via the colors formatoption. This can be one on 'u' (to use the x-direction), 'v' (to use the 'y'-direction) or 'absolute' to use the absolute length of the arrows.
[4]:
p.update(cmap='Reds', color='absolute')
p.show()
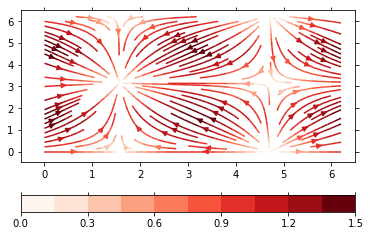
The vector plot method also supports stream plots through the plot formatoption.
[5]:
p.update(plot='stream', arrowsize=1.0)
p.show()
The main formatoptions for the vector plots are in the vector group
[6]:
p.summaries('vector')
arrowsize
    Change the size of the arrows
arrowstyle
    Change the style of the arrows
density
    Change the density of the arrows
[7]:
psy.close('all')