Note
2D plots
Demonstration of the 2D plot capabilities
The plot2d plot method make plots of 2-dimensional scalar data using matplotlibs pcolormesh or the contourf functions.
Note that this method is extended by the mapplot plot method of the psy-maps plugin for visualization on the projected globe.
[1]:
import psyplot.project as psy
import xarray as xr
%matplotlib inline
%config InlineBackend.close_figures = False
import numpy as np
First we create some sample data in the form of a 2D parabola
[2]:
x = np.linspace(-1, 1.)
y = np.linspace(-1, 1.)
x2d, y2d = np.meshgrid(x, y)
z = - x2d**2 - y2d**2
ds = xr.Dataset(
    {'z': xr.Variable(('x', 'y'), z)},
    {'x': xr.Variable(('x', ), x), 'y': xr.Variable(('y', ), y)})
For a simple 2D plot of a scalar field, we can use the plot2d plot method:
[3]:
p = psy.plot.plot2d(ds, cmap='Reds', name='z')
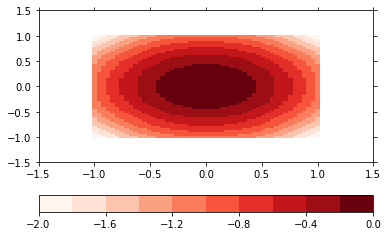
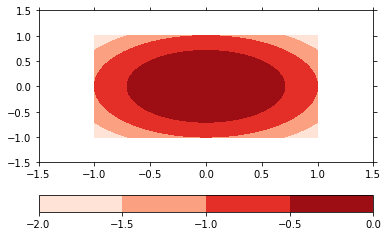
The plot formatoption controls, how the plot is made. The default is a pcolormesh plot, but we can also make a filled contour plot. The levels of the contour plot are determined through the levels formatoption.
[4]:
p.update(plot='contourf', levels=5)
p.show()
The plot2d method has several formatoptions controlling the color coding of your plot:
[5]:
p.keys('colors')
+-------------+-------------+-------------+-------------+
| levels      | miss_color  | cmap        | bounds      |
+-------------+-------------+-------------+-------------+
| extend      | cbar        | cbarspacing | cticksize   |
+-------------+-------------+-------------+-------------+
| ctickweight | ctickprops  |             |             |
+-------------+-------------+-------------+-------------+
The most important ones are
cbar: To specify the location of the colorbarbounds: To specify the boundaries for the color coding, i.e. the categories which data range belongs to which colorcmap: To specify the colormap
[6]:
psy.close('all')